Pump Curve Display
The user can obtain a display of pump curves (after a run) by right clicking on the pump and selecting Pump Curve. The user then sees a dialog where the type of curve and time steps, for which the curve is plotted, are controlled.
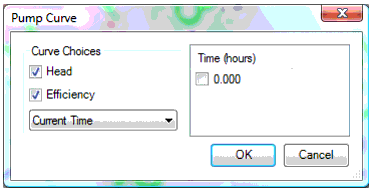
The default options are to plot both the head and efficiency curve at the current time. The types of curves can be turned off by unchecking the boxes. A plot for a single time step look like the graph below.
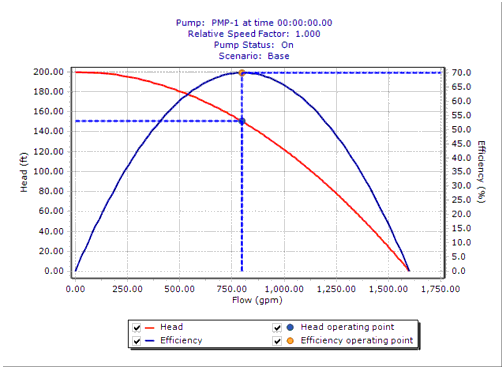
The graph shows both the head and efficiency curve and highlights the operating point for the current time step. If the pump is Off, the operating point is plotted at the origin.
The buttons on top of the drawing control the display. The first button enables the user to modify the look of the graph by changing colors, fonts, legends, etc. The second button prints the graph while the third is a print preview. The fourth copies the graph to the clipboard.
In the case of an EPS run, if the user wants to view more than the current time step, he should pick Selected Times from the drop down.
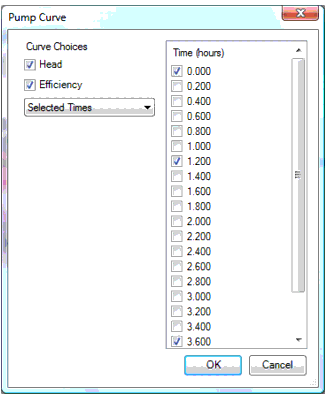
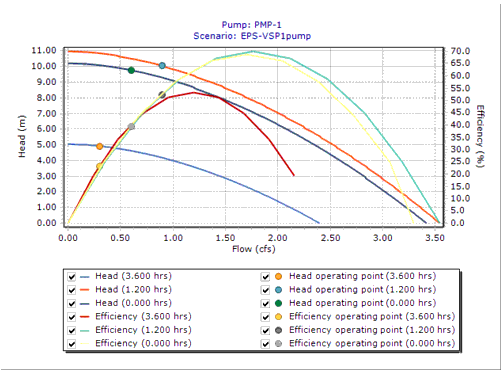
If the pump is a constant speed pump, then a single head and efficiency curve are shown with multiple points showing each selected time.

If a variable speed pump is selected, then a separate head and efficiency curve are generated for each time step.
If the user picks Current Time for an EPS run, it is possible to user the Time Browser to animate the pump curve and operating points moving over time.